This live report demonstrates how CK can
help create researchers reproducible and interactive article from reusable components
- GitHub repository with shared artifacts in CK format: reproduce-ck-paper,
reproduce-ck-paper-large-experiments,
ctuning-programs,
ctuning-datasets-min,
ck-analytics,
ck-autotuning,
ck-env
- BIB
- Open archive (HAL) with PDF
- Related DATE'16 article (PDF)
- Wiki describing how to reproduce some experiments via CK
- Related Collective Knowledge infrastructure and repository (CK)
- Related Collective Mind infrastructure and repository (deprecated for CK)
- Extends our previous work: 1,
2,
3,
4,
5
- Supports our open publication model
Abstract
Empirical auto-tuning and machine learning techniques have been
showing high potential to improve execution time, power
consumption, code size, reliability and other important metrics
of various applications for more than two decades.
However, they are still far from widespread production use
due to lack of native support for auto-tuning in an ever changing
and complex software and hardware stack, large and
multi-dimensional optimization spaces, excessively long
exploration times, and lack of unified mechanisms for preserving
and sharing of optimization knowledge and research material.
We present a possible collaborative approach to solve above
problems using Collective Mind knowledge management system.
In contrast with previous cTuning framework, this modular
infrastructure allows to preserve and share through the Internet the
whole auto-tuning setups with all related artifacts and their
software and hardware dependencies besides just performance data.
It also allows to gradually structure, systematize and describe
all available research material including tools, benchmarks, data
sets, search strategies and machine learning models. Researchers
can take advantage of shared components and data with extensible
meta-description to quickly and collaboratively validate and
improve existing auto-tuning and benchmarking techniques
or prototype new ones. The community can now gradually learn and
improve complex behavior of all existing computer systems while
exposing behavior anomalies or model mispredictions to an
interdisciplinary community in a reproducible way for further
analysis. We present several practical, collaborative and
model-driven auto-tuning scenarios. We also decided to release
all material at c-mind.org/repo
to set up an example for
a collaborative and reproducible research as well as our new
publication model in computer engineering where experimental
results are continuously shared and validated by the community.
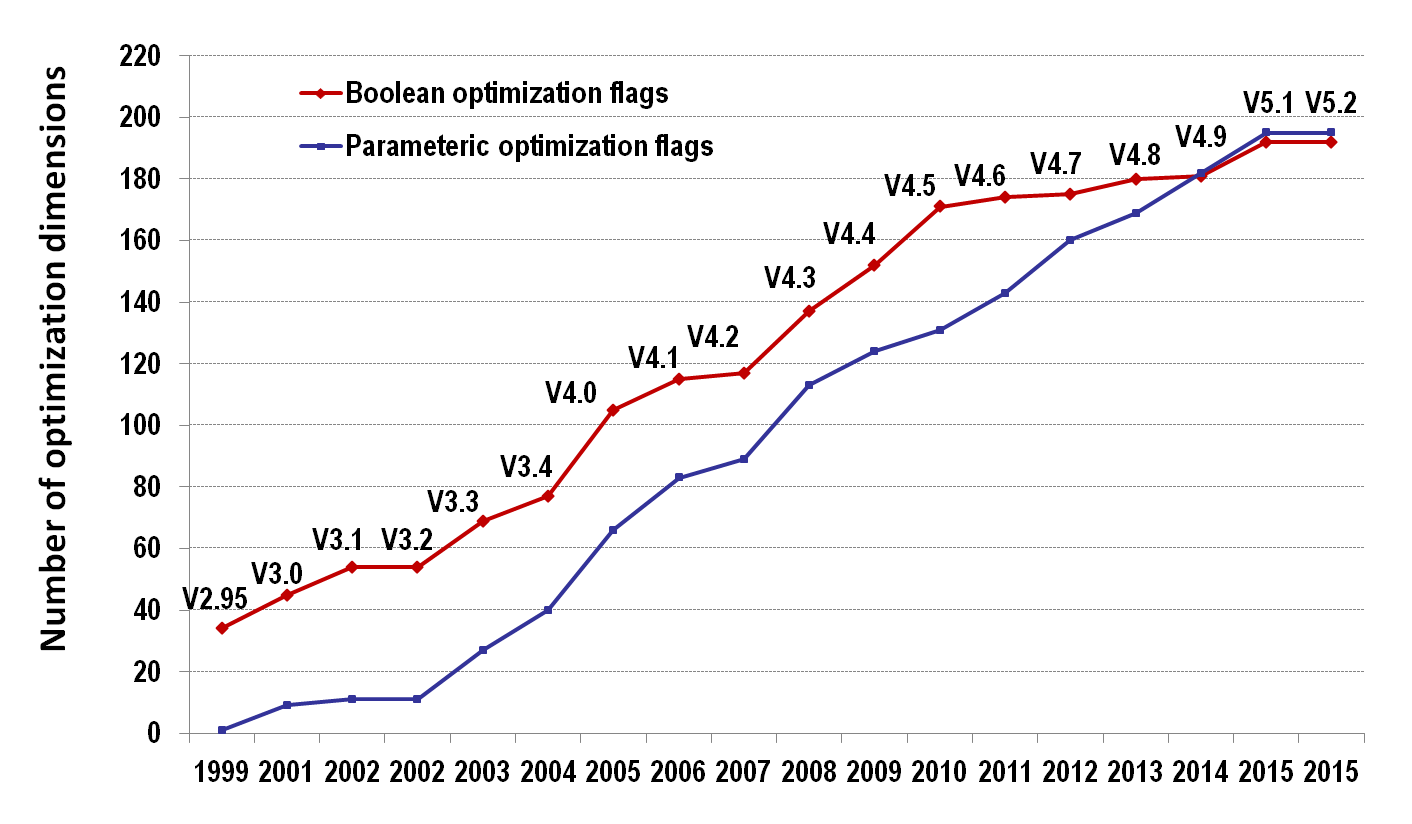
Raising number of compiler flags in GCC

Reproducibility: CK scripts with CID=84e27ad9dd12e734:bbf4abb470b0271a
Note the trend of slowing down total number of boolean optimizations and rising number of parameteric optimizations.
Unified, reproducible, multi-objective, compiler flag autotuning examples powered by CK
We prepared Getting Started Guide about how to reproduce various autotuning scenarios
(including from this paper) via CK in your environment (hardware and software).
You can find it here.
Interactive graph of slambench v1.1 cpu autotuning
Reproduce/reuse/replay/discuss via CK (interactive graphs)
- Samsung ChromeBook 2; Samsung EXYNOS5; ARM Cortex A15/A7; ARM Mali-T628; Ubuntu 12.04; video 640x480
- Big green dot: Clang 3.6.0 -O3
- Big red dot: GCC 4.9.2 -O3
- Small blue dots: random GCC 4.9.2. optimization flags (with 10% probablitiy of a selection of a given flag)
- Small red dots: Pareto frontier
More examples of reproducible, collaborative and live slambench experiments via CK:
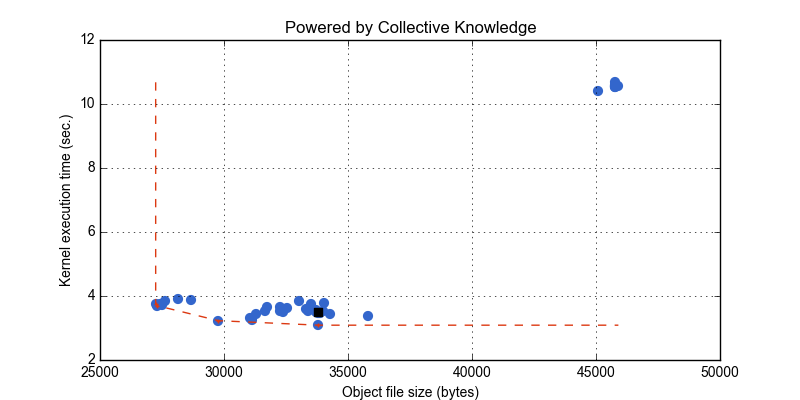
Non-interactive graph of image corner detection algorith (susan corners) autotuning
Reproduce/reuse/replay/discuss via CK (interactive graphs)
- LENOVO X240; Intel(R) Core(TM) i5-4210U CPU @ 1.70GHz; Intel HD Graphics 4400; Windows 7 Pro
- Image image-pgm-0001; 600x450; 270015 bytes
- Black square dot: MingW GCC 4.9.2 -O3
- Blue dots: random optimization flags (with 10% probablitiy of a selection of a given flag)
- Red line: Pareto frontier

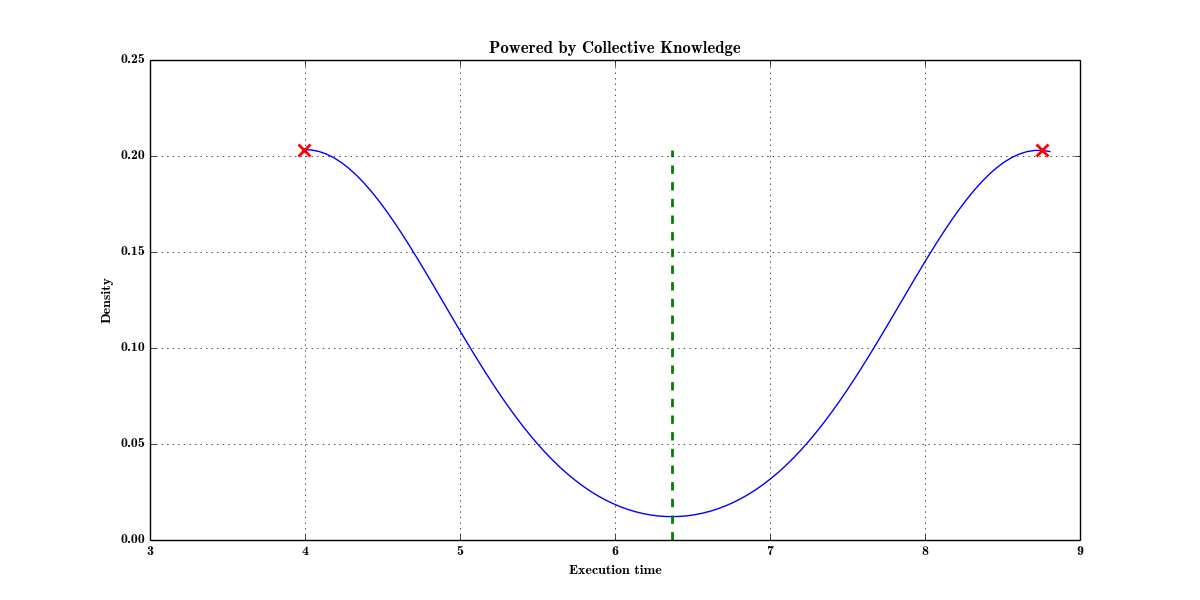
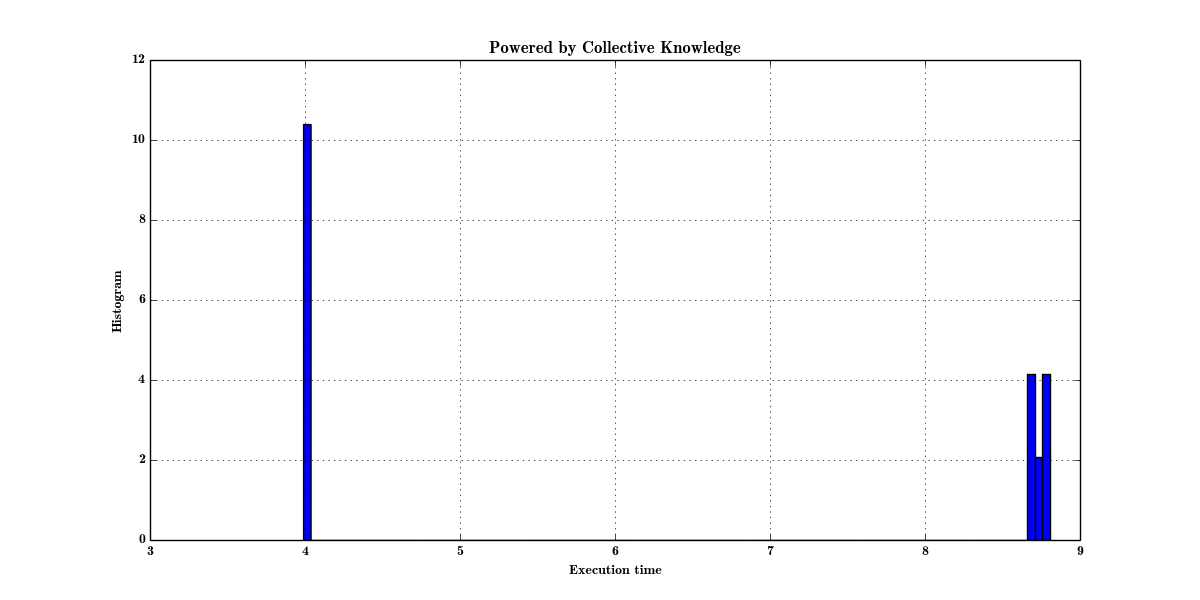
Non-interactive graph of analysis of execution time variation of image/neuron filter kernel versus different frequency
CK scripts: reproduce.py
- Raw experiments in CK: high frequency,
low frequency
- Average time (green line) doesn't make sense. Normality test also fails. So most of the time, researchers will simply skip this result.
- In CK, we analyze variation via gaussian KDE from scipy, which returns 2 expected values in the following graphs suggesting
that there are several states in experiments and hence some features are missing, that can separate these states. In our case,
the feature is frequency that was added to program pipeline. See paper for more details.
Density graph

Histogram graph

Note: CK allows the community validate the results and share unexpected behavior in public cknowledge.org/repo
here.
Note: we are gradually converting all the code and data related to this paper
from the deprecated Collective Mind Format to the new Collective Knowledge Framework.

